
Information for Press and Media
Tuesday, 13 December 2022
Below you can find key information and statistics about the UK plastics industry, including information about how much plastic the UK imports and exports and key plastic recycling statistics.
We have a team of experts in many subsectors as well as a network of key industry figures, so if you are from the media and the information you require is not below, please get in touch and we’ll try to help if we can. Please be aware that key data sometimes takes a year or even longer to become publicly available due to the complexities involved in preparing it.
This page contains:
Key statistics and facts about the size of the UK plastics industry
Key statistics and facts about recycling plastics in the UK
Key facts about the UK’s plastic imports and exports
Information about the main markets for plastic in the UK
Key statistics and facts about plastic packaging
Key statistics and facts about the size of the UK plastics industry
There are 5,800 companies in the UK plastics industry, supporting local economies across the UK (only 2% of them are in London).
The plastics industry is very broad and includes raw material suppliers, additives suppliers, machinery suppliers and recyclers, as well as companies that manufacture a huge range of plastic products.
The UK produces 1.7m tonnes of plastic material per year.
The UK processes 3.4m tonnes of plastic per year. ‘Processing’ plastic means it is turned into a product of some kind.
The UK plastics industry directly employs 155,000 people. That makes the UK plastics industry one of the largest employers in the manufacturing sector.
Plastic and plastic products are one of the UK’s top ten exports. In fact, they are ninth, accounting for 2.5% of exports from the UK, which equates to £10.5bn (2022 data).
Sources available at: bpf.co.uk/industry/sources
Key statistics and facts about recycling plastics in the UK
Recycling saves between 30% and 80% of the carbon emissions generated by virgin plastic processing and manufacturing.[1]
In 2022, 49% of plastic packaging was recycled.
The amount of post-consumer plastic (including packaging and non-packaging) the UK recycles nearly tripled between 2006 and 2020.
In 2021, 75% of PET drinks bottles were recycled. A ‘PET drinks bottle’ is your average water/fizzy drinks bottle, as opposed to a milk bottle, for example, which is made of a different type of plastic (HDPE).
37% of all post-consumer plastic is recycled. This includes much more than just plastic packaging, such as plastic used in agriculture, construction, electronics, cars, houseware, leisure and sport.
61% of all plastic bottles are collected for recycling. This statistic includes all plastic bottles such as milk, shampoo and bleach bottles.
86% of plastic packaging is recovered and 81% of post-consumer plastic is recovered. When the recycling and waste management industries refer to ‘recovered’ material, it means it was collected after use and was not sent to landfill but repurposed in some way. The term includes material that is recycled as well as material used to generate electricity at an energy from waste (EFW) facility.
Countries use different sets of measures to report how much plastic they recycle, so it is not always straightforward to compare recycling rates between countries. When it comes to post-consumer plastic packaging, 2018 data shows that the UK came 10th (out of the EU28+2).
Wales has the 3rd best household recycling rate in the world. It is worth noting that Wales has a well-established ‘consistent collection scheme’, meaning that the same material is collected for recycling across the entire country, which makes communicating what can and cannot be recycled much simpler.
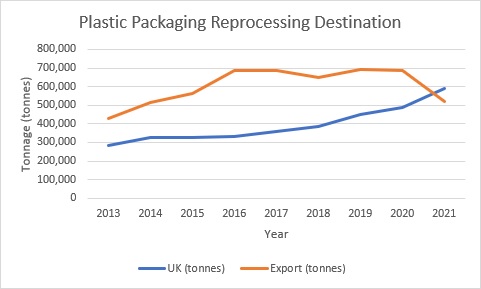 The UK exports some of its plastic for recycling because it does not currently have capacity to recycle all of the plastic waste it produces. However, the amount of plastic the UK has been exporting for recycling has reduced. In 2021, the UK recycled 592,783 tonnes of plastic within the country and exported 519,005 tonnes to be recycled.[2]
By using mechanical recycling to reprocess the majority of used plastic and non-mechanical recycling (typically referred to under the umbrella term ‘chemical recycling’) as a complementary technology for the rest, most of the plastic the UK uses could be recycled within the country by 2030, with only 1% going to landfill and very little exported, provided the right drivers are in place.[3] To achieve this, a number of things need to change, including investing in the UK’s recycling infrastructure, simplifying household collection schemes across the UK and collecting plastic film and flexible packaging, which is actually common in Europe, with the UK being one of a few outliers.[4]
For sources of data that does not have a footnote above visit: www.bpf.co.uk/Sustainability/Plastics_Recycling
For more detailed information visit the BPF’s webpage about plastic recycling.
For export destination data see the BPF's Recycling Roadmap
Key facts about the UK’s plastic imports and exports
The following data is for plastic materials and plastic products combined and is for the year 2021.
Providing imports to the UK:
World – £15.2bn
Europe (entire continent) - £10bn (65% of imports)
EU27 - £9.7bn (64% of imports)
Asia - £4bn (26% of imports)
North America - £1.1bn (8% of imports)
South America - £13m (0.1% of imports)
Africa – £124m (1% of imports)
Oceania - £31m (0.2% of imports)
Receiving exports from the UK:
World – £9.4bn
Europe (entire continent) - £6.6bn (70% of exports)
EU27 - £6.2bn (67% of exports)
Asia - £1.3bn (13% of exports)
North America - £1bn (11% of exports)
South America - £158m (2% of exports)
Africa – £220m (2% of exports)
Oceania - £150m (2% of exports)
[Source: ITC calculations based on UN COMTRADE statistics, using product code 39 (‘plastics and articles thereof’). Figures were converted from dollars at the average exchange rate for 2021, meaning £1 equals $1.377525.]
What are the main markets for plastic in the UK?
Plastic is used in many applications and is vital to many industries. Below is a breakdown of where plastic is used across the EU as well as Norway, Switzerland and the United Kingdom. The data below applies only to ‘virgin’ plastic, meaning it does not include the use and destinations of recycled plastic material.
Across the EU member states as well as Norway, Switzerland and the United Kingdom, in 2021 the end markets for virgin plastic were:
40.5% was used in packaging. This figure includes commercial and industrial packaging.
20.4% was used in building and construction
8.8% was used in automotive applications
6.2% was used in electrical and electronic equipment
4.3% was used in household, leisure and sports products
3.2% was used in agriculture
16.7% was used in various other applications not covered above
[Source: Plastics Europe, Plastics the Facts 2021]
Key statistics and facts about plastic packaging
Plastic waste needs to be managed properly so that as much material remains in use for as long as possible and it does not end up in the environment. Plastic is very lightweight and resource efficient, however, and if we replaced plastic packaging with alternative materials, two studies have estimated that greenhouse gas emissions would increase by nearly three times and a third study found they would almost double.[13] Therefore the ongoing debate about how to minimise the impact of plastic on the environment is more complex than simply substituting the material.
A 2020 study from Imperial College London stated: “Plastics do have a large carbon impact - accounting for 3.8% of global greenhouse gases emissions - but it is wrong to assume that alternative packaging materials would perform better, and it is important to consider the carbon benefits that arise from plastics use.”[14]
A summary of research into this area that was published by Denkstatt in 2020 stated: “Compared to alternative materials, current plastic packaging used in Europe and North America generate 116 Mill tonnes less CO2e per year, which is equivalent to the impact of 25 coal fired 500 MW power plants.”[15]
Plastic packaging extends the shelf life of food, which often has to travel long distances. This helps to reduce food waste, which is responsible for 8% of global GHG emissions.[16] 14% of food in the world is lost before it even reaches a retailer.[17]
The packaging for one kilogram of food on average creates 70 grams of CO2 but prevents 350 grams of CO2 due to food waste.[18] A typical steak, to take one of the more extreme examples, produces 7.5kg of CO2 on its journey from farm to fork whereas the packaging protecting it produces 80g of CO2 and extends its shelf life by ten days.[19]
In the UK, more than a fifth of the food we buy is wasted after it leaves the farm and 71% of wasted food comes from households.[20] This means that the UK wastes £19bn of food every year, which equates to 25 million tonnes of greenhouse gas (GHG) emissions.[21]
For more information and further statistics, visit the BPF’s Frequently Asked Questions About Plastic.
Recycling statistics and information
Third party publications and independent studies
For media enquiries please contact Head of Media and PR Rob Mills.
email: [email protected]
[1] Voulvoulis et al., Imperial College London, ‘Examining Material Evidence’, The Carbon Fingerprint Report, Imperial College
[2] National Packaging Waste Database
[3] BPF Recycling Roadmap (2021) https://www.bpf.co.uk/roadmap.aspx
[4] Plastics Recyclers Europe – Flexible Films Market in Europe: State of Play (2020)
[13] Green Alliance – Fixing the System (2020), Denkstatt (2011), Franklin Associates (2018)
[14] Imperial College – Examining Material Evidence: The Carbon Fingerprint (2020)
[15] Denkstatt – Plastics and Climate in Perspective (2020)
[16] The Food and Agriculture Organization of the United Nations – Food wastage footprint & Climate Change
[17] The Food and Agriculture Organization of the United Nations – Food Loss Index
[18] Denkstatt – How Packaging Contributes to Food Waste Prevention (2017)
[19] Lesschen et al – Greenhouse gas emission profiles of European livestock sectors (2011) and Denkstatt – How Packaging Contributes to Food Waste Prevention (2017)
[20] WRAP – Food surplus and waste in the UK – key facts (2020 update)
[21] WRAP – Food surplus and waste in the UK – key facts (2020 update)